
Welcome to the first post in our series on eBPF for debugging! In this post, we’ll introduce you to the basics of eBPF and show you how to get started with simple yet powerful tools for tracing and debugging your Linux systems.
What is eBPF?
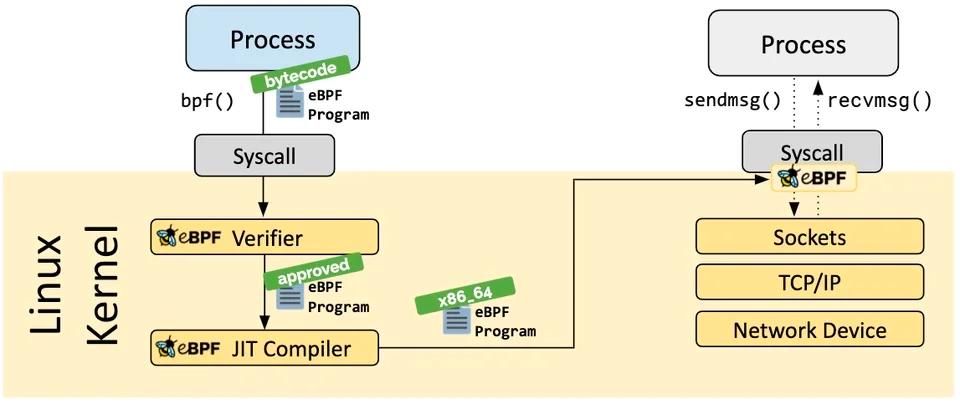
eBPF (extended Berkeley Packet Filter) is a revolutionary technology that allows you to run sandboxed programs in the Linux kernel without changing the kernel source code or loading kernel modules. Think of it as a lightweight, in-kernel virtual machine that provides a safe and efficient way to add new capabilities to the kernel at runtime.
Originally focused on network packet filtering, eBPF has evolved to become a general-purpose tool for a wide range of use cases, including:
- Networking: High-performance packet processing and filtering.
- Observability: Collecting detailed performance metrics and events.
- Security: Monitoring system calls and network activity to enforce security policies.
- Tracing and Debugging: Gaining deep insights into kernel and application behavior.
Setting Up Your Environment
To get started with eBPF, you’ll need a modern Linux distribution. For this guide, we’ll focus on tools available in Ubuntu 24.04 and later, where many eBPF tools are included by default.
The two main toolsets we’ll be using are:
- BCC (BPF Compiler Collection): A collection of powerful command-line tools and a Python framework for creating custom eBPF programs.
bpftrace: A high-level tracing language that makes it easy to write custom eBPF tracing scripts with a simple syntax.
You can install these tools on Ubuntu with:
sudo apt-get update
sudo apt-get install -y bcc bpftrace
Your First Traces with bpftrace
bpftrace is the perfect tool for beginners to start exploring eBPF. It provides a simple, awk-like syntax for writing one-liners and small scripts to trace kernel and user-space events.
Let’s try a few basic examples:
1. Tracing new processes: This one-liner will print the name of every new process that is executed on the system.
sudo bpftrace -e 'tracepoint:syscalls:sys_enter_execve { printf("%s\n", comm); }'
2. Counting system calls: This command will count all system calls and print a summary every second.
sudo bpftrace -e 'tracepoint:raw_syscalls:sys_enter { @[probe] = count(); } interval:s:1 { print(@); }'
3. Tracing open() system calls:
This will trace all open() system calls, showing the process name and the file being opened.
sudo bpftrace -e 'tracepoint:syscalls:sys_enter_openat { printf("%s %s\n", comm, str(args->filename)); }'
These are just a few simple examples, but they demonstrate the power and simplicity of bpftrace. In the next post in this series, we’ll explore more advanced techniques and introduce you to the tools in the BCC collection. Stay tuned!
Comments